Crested Shrike-tit
Falcunculus frontatus
ABR description
The following is extracted from the Annual Bird Report for the twelve months to June 2017.
Rare, breeding resident
A sparsely, but widely distributed species. Its reporting rate has fallen significantly since its 1990s peak.
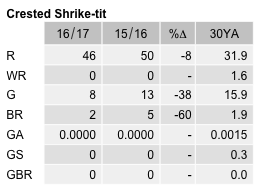
General: 77 birds recorded, more than last year (86) and the 10YA (61) and the 30YA (47). Reporting rate (0.3%) similar to last year (0.4%), though well below the 10YA (0.7%) and the 30YA (1.2%). The current reporting rate is at its lowest value ever, and is the result of continuous decline since 1996, although there was some recovery in the period 2004-07. Recorded in all months but Nov, with a higher proportion of records in spring (23%), summer (44%) and autumn (23%) than in winter (10%). Recorded from just 2.9% of grid cells surveyed (4.4% last year). Max 6 (last year 5), mean 1.6, median 1. 3 breeding records (5 last year): dy/5 Feb Tidbinbilla Bushland Meander GrF18 (ZwM1), dy/5 Feb TNR (Black Flats) GrF18 (ZwM1) and dy/5 Mar Nelangelo (TSR48) GrO05 (LeM1).
Abundance
Abundance is the average number of birds of that species per survey. Where the species was observed (presence recorded) but the number of birds seen was not recorded, this is treated as a count of zero.
Abundance by year
This chart shows the abundance of Crested Shrike-tit between 1982 and 2017. 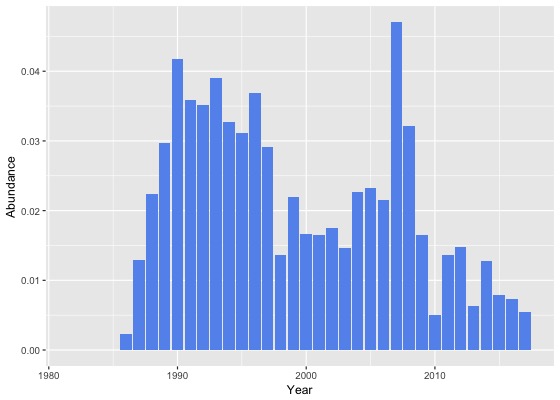
Abundance by month
This chart shows the monthly abundance of Crested Shrike-tit. The blue lines show the abundance for the twelve months to June 2017 and the bars show the average abundance for the period 1982 to 2017. 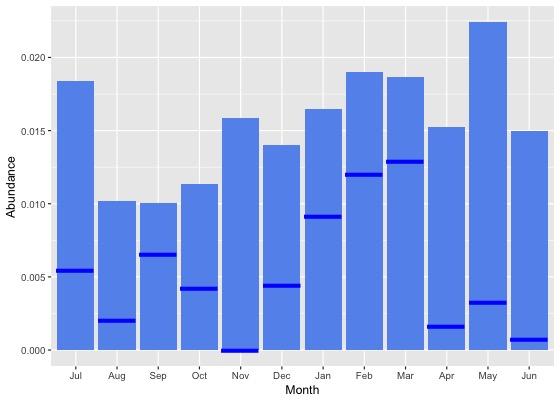
Abundance by season
This chart shows the seasonal abundance of Crested Shrike-tit. The blue lines show the seasonal abundance for the twelve months to June 2017 and the bars show the average seasonal abundance for the period 1982 to 2017. 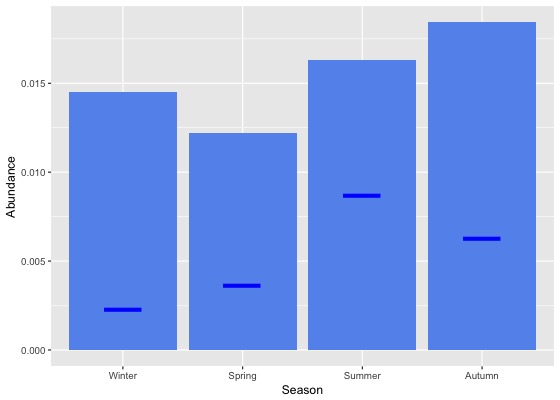
Abundance data
| Month | Season | ||||||||||||||||||
|---|---|---|---|---|---|---|---|---|---|---|---|---|---|---|---|---|---|---|---|
| Period | Jul | Aug | Sep | Oct | Nov | Dec | Jan | Feb | Mar | Apr | May | Jun | Winter | Spring | Summer | Autumn | All | ||
| All years | |||||||||||||||||||
| All | 0.0 | 0.0 | 0.0 | 0.0 | 0.0 | 0.0 | 0.0 | 0.0 | 0.0 | 0.0 | 0.0 | 0.0 | 0.0 | 0.0 | 0.0 | 0.0 | 0.0 | ||
| Previous years | |||||||||||||||||||
| All previous years | 0.0 | 0.0 | 0.0 | 0.0 | 0.0 | 0.0 | 0.0 | 0.0 | 0.0 | 0.0 | 0.0 | 0.0 | 0.0 | 0.0 | 0.0 | 0.0 | 0.0 | ||
| Previous 30 years | 0.0 | 0.0 | 0.0 | 0.0 | 0.0 | 0.0 | 0.0 | 0.0 | 0.0 | 0.0 | 0.0 | 0.0 | 0.0 | 0.0 | 0.0 | 0.0 | 0.0 | ||
| Previous 20 years | 0.0 | 0.0 | 0.0 | 0.0 | 0.0 | 0.0 | 0.0 | 0.0 | 0.0 | 0.0 | 0.0 | 0.0 | 0.0 | 0.0 | 0.0 | 0.0 | 0.0 | ||
| 10 year groups | |||||||||||||||||||
| [2007,2017) | 0.0 | 0.0 | 0.0 | 0.0 | 0.0 | 0.0 | 0.0 | 0.0 | 0.0 | 0.0 | 0.0 | 0.0 | 0.0 | 0.0 | 0.0 | 0.0 | 0.0 | ||
| [1997,2007) | 0.0 | 0.0 | 0.0 | 0.0 | 0.0 | 0.0 | 0.0 | 0.0 | 0.0 | 0.0 | 0.0 | 0.0 | 0.0 | 0.0 | 0.0 | 0.0 | 0.0 | ||
| [1987,1997) | 0.0 | 0.0 | 0.0 | 0.0 | 0.0 | 0.0 | 0.0 | 0.0 | 0.0 | 0.0 | 0.0 | 0.0 | 0.0 | 0.0 | 0.0 | 0.0 | 0.0 | ||
| 5 year groups | |||||||||||||||||||
| [2012,2017) | 0.0 | 0.0 | 0.0 | 0.0 | 0.0 | 0.0 | 0.0 | 0.0 | 0.0 | 0.0 | 0.0 | 0.0 | 0.0 | 0.0 | 0.0 | 0.0 | 0.0 | ||
| [2007,2012) | 0.1 | 0.0 | 0.0 | 0.0 | 0.0 | 0.0 | 0.0 | 0.0 | 0.0 | 0.0 | 0.0 | 0.0 | 0.0 | 0.0 | 0.0 | 0.0 | 0.0 | ||
| [2002,2007) | 0.0 | 0.0 | 0.0 | 0.0 | 0.0 | 0.0 | 0.0 | 0.0 | 0.0 | 0.0 | 0.0 | 0.0 | 0.0 | 0.0 | 0.0 | 0.0 | 0.0 | ||
| [1997,2002) | 0.0 | 0.0 | 0.0 | 0.0 | 0.0 | 0.0 | 0.0 | 0.0 | 0.0 | 0.0 | 0.0 | 0.0 | 0.0 | 0.0 | 0.0 | 0.0 | 0.0 | ||
| [1992,1997) | 0.0 | 0.0 | 0.0 | 0.0 | 0.1 | 0.1 | 0.0 | 0.0 | 0.0 | 0.0 | 0.1 | 0.0 | 0.0 | 0.0 | 0.0 | 0.0 | 0.0 | ||
| [1987,1992) | 0.0 | 0.0 | 0.0 | 0.0 | 0.0 | 0.0 | 0.0 | 0.0 | 0.0 | 0.0 | 0.0 | 0.0 | 0.0 | 0.0 | 0.0 | 0.0 | 0.0 | ||
| Year | |||||||||||||||||||
| 2017 | 0.0 | 0.0 | 0.0 | 0.0 | 0.0 | 0.0 | 0.0 | 0.0 | 0.0 | 0.0 | 0.0 | 0.0 | 0.0 | 0.0 | 0.0 | 0.0 | 0.0 | ||
| 2016 | 0.0 | 0.0 | 0.0 | 0.0 | 0.0 | 0.0 | 0.0 | 0.0 | 0.0 | 0.0 | 0.0 | 0.0 | 0.0 | 0.0 | 0.0 | 0.0 | 0.0 | ||
| 2015 | 0.0 | 0.0 | 0.0 | 0.0 | 0.0 | 0.0 | 0.0 | 0.0 | 0.0 | 0.0 | 0.0 | 0.0 | 0.0 | 0.0 | 0.0 | 0.0 | 0.0 | ||
| 2014 | 0.0 | 0.0 | 0.0 | 0.0 | 0.0 | 0.0 | 0.0 | 0.0 | 0.0 | 0.0 | 0.0 | 0.0 | 0.0 | 0.0 | 0.0 | 0.0 | 0.0 | ||
| 2013 | 0.0 | 0.0 | 0.0 | 0.0 | 0.0 | 0.0 | 0.0 | 0.0 | 0.0 | 0.0 | 0.0 | 0.0 | 0.0 | 0.0 | 0.0 | 0.0 | 0.0 | ||
| 2012 | 0.0 | 0.0 | 0.0 | 0.0 | 0.0 | 0.0 | 0.0 | 0.0 | 0.0 | 0.0 | 0.1 | 0.0 | 0.0 | 0.0 | 0.0 | 0.0 | 0.0 | ||
| 2011 | 0.0 | 0.0 | 0.0 | 0.0 | 0.0 | 0.0 | 0.0 | 0.0 | 0.0 | 0.0 | 0.0 | 0.0 | 0.0 | 0.0 | 0.0 | 0.0 | 0.0 | ||
| 2010 | 0.0 | 0.0 | 0.0 | 0.0 | 0.0 | 0.0 | 0.0 | 0.0 | 0.0 | 0.0 | 0.0 | 0.0 | 0.0 | 0.0 | 0.0 | 0.0 | 0.0 | ||
| 2009 | 0.1 | 0.0 | 0.0 | 0.0 | 0.0 | 0.0 | 0.0 | 0.0 | 0.0 | 0.0 | 0.0 | 0.0 | 0.0 | 0.0 | 0.0 | 0.0 | 0.0 | ||
| 2008 | 0.2 | 0.0 | 0.0 | 0.0 | 0.0 | 0.0 | 0.0 | 0.0 | 0.0 | 0.0 | 0.0 | 0.0 | 0.1 | 0.0 | 0.0 | 0.0 | 0.0 | ||
| 2007 | 0.0 | 0.0 | 0.0 | 0.0 | 0.0 | 0.0 | 0.0 | 0.0 | 0.0 | 0.0 | 0.2 | 0.2 | 0.1 | 0.0 | 0.0 | 0.1 | 0.0 | ||
| 2006 | 0.0 | 0.1 | 0.0 | 0.0 | 0.0 | 0.0 | 0.0 | 0.1 | 0.0 | 0.0 | 0.1 | 0.0 | 0.0 | 0.0 | 0.0 | 0.0 | 0.0 | ||
| 2005 | 0.0 | 0.0 | 0.0 | 0.0 | 0.0 | 0.0 | 0.1 | 0.0 | 0.1 | 0.0 | 0.0 | 0.0 | 0.0 | 0.0 | 0.0 | 0.0 | 0.0 | ||
| 2004 | 0.0 | 0.0 | 0.0 | 0.0 | 0.0 | 0.0 | 0.0 | 0.1 | 0.0 | 0.0 | 0.0 | 0.0 | 0.0 | 0.0 | 0.0 | 0.0 | 0.0 | ||
| 2003 | 0.0 | 0.0 | 0.0 | 0.0 | 0.0 | 0.0 | 0.0 | 0.0 | 0.0 | 0.0 | 0.1 | 0.0 | 0.0 | 0.0 | 0.0 | 0.0 | 0.0 | ||
| 2002 | 0.0 | 0.0 | 0.0 | 0.0 | 0.0 | 0.0 | 0.0 | 0.0 | 0.0 | 0.0 | 0.0 | 0.0 | 0.0 | 0.0 | 0.0 | 0.0 | 0.0 | ||
| 2001 | 0.0 | 0.0 | 0.0 | 0.0 | 0.0 | 0.0 | 0.0 | 0.0 | 0.0 | 0.0 | 0.0 | 0.0 | 0.0 | 0.0 | 0.0 | 0.0 | 0.0 | ||
| 2000 | 0.0 | 0.0 | 0.0 | 0.0 | 0.0 | 0.0 | 0.0 | 0.0 | 0.0 | 0.0 | 0.0 | 0.0 | 0.0 | 0.0 | 0.0 | 0.0 | 0.0 | ||
| 1999 | 0.0 | 0.0 | 0.0 | 0.0 | 0.0 | 0.0 | 0.0 | 0.0 | 0.1 | 0.0 | 0.0 | 0.0 | 0.0 | 0.0 | 0.0 | 0.0 | 0.0 | ||
| 1998 | 0.0 | 0.0 | 0.0 | 0.0 | 0.0 | 0.0 | 0.0 | 0.0 | 0.0 | 0.0 | 0.0 | 0.0 | 0.0 | 0.0 | 0.0 | 0.0 | 0.0 | ||
| 1997 | 0.1 | 0.0 | 0.0 | 0.0 | 0.1 | 0.0 | 0.0 | 0.0 | 0.0 | 0.0 | 0.0 | 0.0 | 0.1 | 0.0 | 0.0 | 0.0 | 0.0 | ||
| 1996 | 0.0 | 0.0 | 0.0 | 0.0 | 0.1 | 0.1 | 0.0 | 0.0 | 0.0 | 0.1 | 0.1 | 0.0 | 0.0 | 0.1 | 0.0 | 0.0 | 0.0 | ||
| 1995 | 0.0 | 0.0 | 0.0 | 0.0 | 0.0 | 0.0 | 0.1 | 0.0 | 0.1 | 0.1 | 0.0 | 0.0 | 0.0 | 0.0 | 0.0 | 0.1 | 0.0 | ||
| 1994 | 0.0 | 0.0 | 0.1 | 0.0 | 0.0 | 0.0 | 0.0 | 0.0 | 0.0 | 0.0 | 0.1 | 0.0 | 0.0 | 0.0 | 0.0 | 0.1 | 0.0 | ||
| 1993 | 0.1 | 0.0 | 0.0 | 0.0 | 0.1 | 0.1 | 0.1 | 0.0 | 0.0 | 0.0 | 0.0 | 0.0 | 0.0 | 0.1 | 0.1 | 0.0 | 0.0 | ||
| 1992 | 0.1 | 0.0 | 0.0 | 0.1 | 0.0 | 0.0 | 0.0 | 0.0 | 0.1 | 0.0 | 0.0 | 0.0 | 0.0 | 0.0 | 0.0 | 0.0 | 0.0 | ||
| 1991 | 0.0 | 0.0 | 0.0 | 0.0 | 0.0 | 0.0 | 0.1 | 0.1 | 0.1 | 0.0 | 0.0 | 0.0 | 0.0 | 0.0 | 0.0 | 0.1 | 0.0 | ||
| 1990 | 0.0 | 0.0 | 0.0 | 0.0 | 0.0 | 0.0 | 0.1 | 0.0 | 0.1 | 0.1 | 0.1 | 0.0 | 0.0 | 0.0 | 0.0 | 0.1 | 0.0 | ||
| 1989 | 0.0 | 0.0 | 0.0 | 0.0 | 0.0 | 0.1 | 0.0 | 0.0 | 0.0 | 0.0 | 0.0 | 0.0 | 0.0 | 0.0 | 0.0 | 0.0 | 0.0 | ||
| 1988 | 0.0 | 0.0 | 0.0 | 0.0 | 0.0 | 0.0 | 0.0 | 0.0 | 0.0 | 0.0 | 0.0 | 0.0 | 0.0 | 0.0 | 0.0 | 0.0 | 0.0 | ||
| 1987 | 0.0 | 0.0 | 0.0 | 0.0 | 0.0 | 0.0 | 0.0 | 0.0 | 0.0 | 0.0 | 0.0 | 0.0 | 0.0 | 0.0 | 0.0 | 0.0 | 0.0 | ||
| 1986 | 0.0 | 0.0 | 0.0 | 0.0 | 0.0 | 0.0 | 0.0 | 0.0 | 0.0 | 0.0 | 0.0 | 0.0 | 0.0 | 0.0 | 0.0 | 0.0 | 0.0 | ||
| 1985 | 0.0 | 0.0 | 0.0 | 0.0 | 0.0 | 0.0 | 0.0 | 0.0 | 0.0 | 0.0 | 0.0 | 0.0 | 0.0 | 0.0 | 0.0 | 0.0 | 0.0 | ||
| 1984 | 0.0 | 0.0 | 0.0 | 0.0 | 0.0 | 0.0 | 0.0 | 0.0 | 0.0 | 0.0 | 0.0 | 0.0 | 0.0 | 0.0 | 0.0 | 0.0 | 0.0 | ||
| 1983 | 0.0 | 0.0 | 0.0 | 0.0 | 0.0 | 0.0 | 0.0 | 0.0 | 0.0 | - | 0.0 | 0.0 | 0.0 | 0.0 | 0.0 | 0.0 | 0.0 | ||
| 1982 | - | 0.0 | - | 0.0 | 0.0 | 0.0 | - | 0.0 | - | 0.0 | - | 0.0 | 0.0 | 0.0 | 0.0 | 0.0 | 0.0 | ||
Reporting rates
Reporting rate is the proportion of all surveys in which the species was present.
Reporting rate by year
This chart shows the reporting rate of Crested Shrike-tit each year between 1982 and 2017. 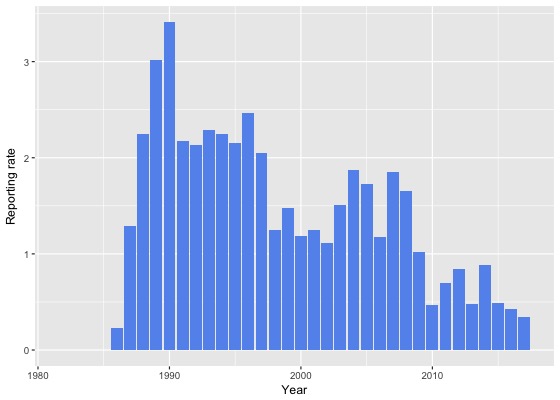
Reporting rate by month
This chart shows the reporting rate by month of Crested Shrike-tit. The blue lines show the reporting rate for the twelve months to June 2017 and the bars show the average reporting rate for the period 1982 to 2017. 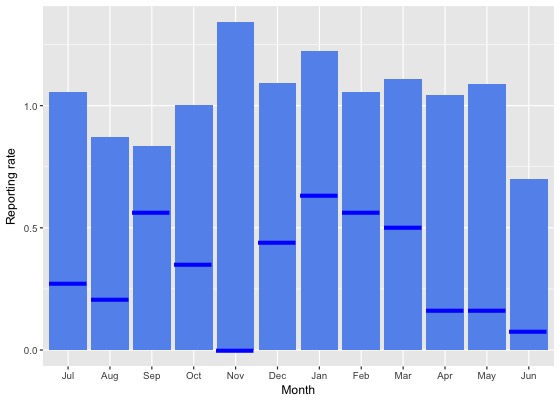
Reporting rate by season
This chart shows the seasonal reporting rate of Crested Shrike-tit. The blue lines show the seasonal reporting rate for the twelve months to June 2017 and the bars show the average seasonal reporting rate for the period 1982 to 2017. 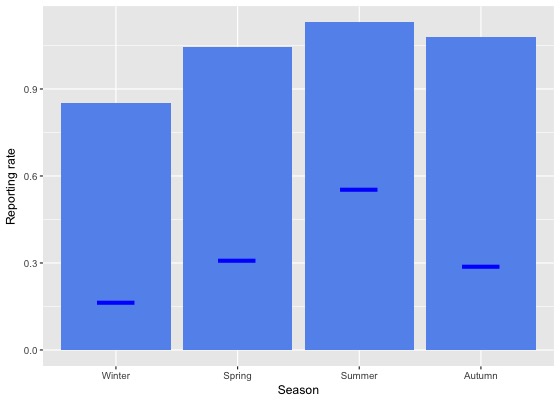
Reporting rate data
| Month | Season | ||||||||||||||||||
|---|---|---|---|---|---|---|---|---|---|---|---|---|---|---|---|---|---|---|---|
| Period | Jul | Aug | Sep | Oct | Nov | Dec | Jan | Feb | Mar | Apr | May | Jun | Winter | Spring | Summer | Autumn | All | ||
| All years | |||||||||||||||||||
| All | 1.1 | 0.9 | 0.8 | 1.0 | 1.3 | 1.1 | 1.2 | 1.1 | 1.1 | 1.0 | 1.1 | 0.7 | 0.9 | 1.0 | 1.1 | 1.1 | 1.0 | ||
| Previous years | |||||||||||||||||||
| All previous years | 1.2 | 1.0 | 0.9 | 1.1 | 1.6 | 1.2 | 1.3 | 1.2 | 1.2 | 1.2 | 1.3 | 0.8 | 1.0 | 1.1 | 1.2 | 1.2 | 1.2 | ||
| Previous 30 years | 1.2 | 1.0 | 0.9 | 1.1 | 1.6 | 1.2 | 1.3 | 1.2 | 1.2 | 1.2 | 1.3 | 0.8 | 1.0 | 1.2 | 1.3 | 1.2 | 1.2 | ||
| Previous 20 years | 1.1 | 0.7 | 0.8 | 0.8 | 1.2 | 0.9 | 1.2 | 1.0 | 0.9 | 0.9 | 1.0 | 0.8 | 0.8 | 0.9 | 1.0 | 0.9 | 0.9 | ||
| 10 year groups | |||||||||||||||||||
| [2007,2017) | 0.9 | 0.4 | 0.5 | 0.6 | 0.8 | 0.7 | 0.9 | 0.8 | 0.7 | 0.8 | 0.8 | 0.8 | 0.7 | 0.7 | 0.8 | 0.7 | 0.7 | ||
| [1997,2007) | 1.3 | 1.4 | 1.2 | 1.5 | 1.9 | 1.3 | 1.9 | 1.6 | 1.5 | 1.2 | 1.5 | 0.8 | 1.1 | 1.5 | 1.6 | 1.4 | 1.4 | ||
| [1987,1997) | 1.6 | 2.0 | 1.5 | 2.7 | 2.9 | 2.8 | 2.5 | 2.1 | 2.8 | 2.9 | 2.5 | 1.1 | 1.6 | 2.4 | 2.5 | 2.7 | 2.3 | ||
| 5 year groups | |||||||||||||||||||
| [2012,2017) | 0.4 | 0.5 | 0.4 | 0.5 | 0.7 | 0.7 | 0.8 | 0.5 | 0.5 | 0.6 | 0.7 | 0.4 | 0.4 | 0.5 | 0.7 | 0.6 | 0.6 | ||
| [2007,2012) | 2.4 | 0.0 | 0.8 | 0.8 | 1.0 | 0.8 | 1.5 | 1.7 | 1.2 | 1.2 | 1.2 | 1.5 | 1.4 | 0.9 | 1.2 | 1.2 | 1.1 | ||
| [2002,2007) | 1.4 | 1.5 | 1.2 | 1.7 | 1.6 | 1.9 | 1.8 | 1.1 | 1.7 | 1.0 | 1.7 | 1.1 | 1.3 | 1.5 | 1.7 | 1.4 | 1.5 | ||
| [1997,2002) | 1.2 | 1.3 | 1.1 | 1.3 | 2.3 | 0.6 | 2.0 | 2.1 | 1.3 | 1.4 | 1.3 | 0.5 | 1.0 | 1.5 | 1.5 | 1.4 | 1.4 | ||
| [1992,1997) | 0.9 | 1.9 | 1.8 | 2.8 | 3.0 | 3.5 | 2.6 | 1.1 | 2.5 | 2.7 | 2.7 | 0.8 | 1.2 | 2.6 | 2.5 | 2.6 | 2.3 | ||
| [1987,1992) | 1.9 | 2.0 | 1.4 | 2.6 | 2.8 | 2.6 | 2.4 | 2.5 | 3.0 | 3.0 | 2.4 | 1.3 | 1.8 | 2.3 | 2.5 | 2.8 | 2.3 | ||
| Year | |||||||||||||||||||
| 2017 | 0.3 | 0.2 | 0.6 | 0.4 | 0.0 | 0.4 | 0.6 | 0.6 | 0.5 | 0.2 | 0.2 | 0.1 | 0.2 | 0.3 | 0.6 | 0.3 | 0.3 | ||
| 2016 | 0.3 | 0.1 | 0.5 | 0.2 | 0.5 | 0.3 | 0.8 | 0.5 | 0.4 | 0.5 | 0.2 | 0.5 | 0.3 | 0.4 | 0.6 | 0.4 | 0.4 | ||
| 2015 | 0.2 | 1.1 | 0.4 | 0.5 | 0.9 | 1.0 | 0.7 | 0.3 | 0.1 | 0.5 | 0.2 | 0.0 | 0.4 | 0.6 | 0.6 | 0.3 | 0.5 | ||
| 2014 | 0.6 | 1.3 | 0.5 | 0.6 | 0.4 | 0.7 | 1.3 | 1.2 | 1.6 | 0.3 | 0.7 | 0.8 | 0.9 | 0.5 | 1.1 | 0.9 | 0.9 | ||
| 2013 | 0.9 | 0.5 | 0.5 | 0.2 | 1.0 | 0.3 | 0.8 | 0.3 | 0.0 | 0.9 | 0.8 | 0.0 | 0.4 | 0.5 | 0.5 | 0.5 | 0.5 | ||
| 2012 | 0.4 | 0.0 | 0.0 | 1.3 | 0.8 | 1.3 | 0.4 | 0.5 | 0.9 | 0.8 | 3.7 | 0.6 | 0.4 | 0.8 | 0.7 | 1.5 | 0.8 | ||
| 2011 | 0.0 | 0.0 | 0.0 | 0.6 | 1.2 | 0.6 | 0.9 | 1.4 | 0.6 | 1.6 | 0.4 | 0.6 | 0.3 | 0.5 | 0.9 | 0.9 | 0.7 | ||
| 2010 | 1.0 | 0.0 | 0.0 | 0.4 | 0.5 | 0.4 | 1.9 | 1.2 | 0.0 | 0.4 | 1.0 | 0.0 | 0.2 | 0.3 | 1.1 | 0.3 | 0.5 | ||
| 2009 | 2.2 | 0.0 | 1.1 | 1.3 | 0.9 | 0.0 | 1.3 | 2.5 | 2.3 | 0.0 | 0.0 | 0.5 | 0.9 | 1.2 | 1.1 | 0.8 | 1.0 | ||
| 2008 | 6.2 | 0.0 | 1.1 | 1.0 | 1.3 | 1.8 | 4.0 | 1.9 | 1.6 | 1.9 | 0.9 | 0.5 | 2.1 | 1.1 | 2.4 | 1.6 | 1.6 | ||
| 2007 | 1.1 | 0.0 | 2.1 | 0.7 | 1.4 | 1.0 | 0.8 | 1.7 | 1.7 | 1.7 | 4.9 | 5.2 | 3.4 | 1.2 | 1.0 | 2.4 | 1.8 | ||
| 2006 | 0.0 | 1.9 | 1.3 | 1.8 | 0.6 | 1.1 | 0.6 | 1.5 | 0.9 | 1.1 | 1.4 | 1.5 | 1.2 | 1.4 | 1.0 | 1.1 | 1.2 | ||
| 2005 | 5.1 | 0.0 | 1.1 | 1.7 | 1.4 | 1.2 | 4.3 | 1.1 | 3.9 | 0.0 | 0.5 | 1.1 | 2.0 | 1.3 | 2.1 | 1.6 | 1.7 | ||
| 2004 | 1.2 | 2.0 | 1.9 | 1.7 | 1.7 | 3.2 | 3.0 | 2.0 | 0.5 | 2.2 | 1.0 | 1.8 | 1.6 | 1.8 | 2.9 | 1.3 | 1.9 | ||
| 2003 | 0.0 | 1.4 | 0.8 | 2.1 | 2.3 | 3.4 | 1.5 | 0.5 | 0.9 | 0.9 | 3.9 | 0.0 | 0.5 | 1.7 | 2.0 | 1.6 | 1.5 | ||
| 2002 | 1.1 | 1.7 | 1.0 | 1.3 | 1.5 | 0.9 | 0.0 | 0.7 | 2.3 | 0.6 | 2.4 | 0.5 | 1.0 | 1.3 | 0.6 | 1.7 | 1.1 | ||
| 2001 | 1.3 | 1.2 | 1.5 | 0.4 | 1.7 | 0.4 | 1.5 | 2.1 | 1.2 | 2.0 | 1.7 | 0.5 | 1.0 | 1.2 | 1.2 | 1.5 | 1.2 | ||
| 2000 | 0.8 | 0.7 | 0.9 | 1.3 | 1.9 | 1.0 | 2.1 | 1.9 | 0.8 | 1.3 | 0.9 | 0.0 | 0.4 | 1.4 | 1.6 | 1.0 | 1.2 | ||
| 1999 | 0.0 | 3.1 | 0.0 | 1.9 | 1.3 | 0.6 | 2.2 | 2.1 | 2.7 | 1.5 | 1.7 | 0.5 | 1.2 | 1.0 | 1.6 | 2.0 | 1.5 | ||
| 1998 | 0.0 | 0.0 | 2.4 | 1.1 | 3.5 | 0.0 | 1.5 | 3.8 | 0.0 | 0.0 | 0.0 | 0.0 | 0.0 | 2.4 | 1.3 | 0.0 | 1.3 | ||
| 1997 | 2.3 | 1.7 | 0.9 | 2.6 | 4.3 | 1.0 | 3.9 | 1.8 | 2.5 | 0.9 | 0.0 | 2.8 | 2.3 | 2.6 | 1.9 | 1.0 | 2.1 | ||
| 1996 | 0.0 | 2.1 | 2.7 | 1.8 | 6.5 | 5.1 | 1.0 | 1.2 | 2.0 | 4.7 | 1.7 | 0.0 | 0.8 | 3.7 | 2.4 | 2.7 | 2.5 | ||
| 1995 | 0.0 | 1.6 | 0.0 | 2.4 | 1.8 | 2.3 | 3.5 | 1.6 | 5.1 | 4.0 | 1.3 | 1.1 | 0.9 | 1.6 | 2.7 | 3.7 | 2.2 | ||
| 1994 | 0.0 | 2.6 | 4.4 | 3.5 | 0.0 | 2.2 | 2.9 | 0.0 | 2.3 | 1.5 | 6.2 | 2.2 | 1.8 | 2.1 | 1.7 | 3.0 | 2.2 | ||
| 1993 | 2.0 | 1.3 | 3.2 | 1.3 | 6.1 | 6.5 | 6.1 | 0.0 | 0.0 | 1.7 | 1.3 | 0.0 | 1.0 | 3.4 | 4.7 | 0.9 | 2.3 | ||
| 1992 | 3.1 | 1.9 | 0.0 | 5.3 | 2.8 | 1.6 | 0.0 | 2.4 | 2.8 | 1.7 | 2.6 | 0.0 | 1.7 | 2.8 | 1.2 | 2.4 | 2.1 | ||
| 1991 | 0.8 | 1.1 | 1.2 | 1.9 | 3.1 | 1.4 | 3.6 | 6.0 | 4.8 | 0.0 | 3.3 | 2.0 | 1.1 | 2.1 | 3.3 | 2.7 | 2.2 | ||
| 1990 | 4.5 | 3.2 | 0.0 | 3.1 | 0.9 | 2.8 | 6.9 | 4.2 | 5.7 | 7.1 | 2.7 | 0.0 | 3.1 | 1.3 | 4.7 | 5.3 | 3.4 | ||
| 1989 | 1.0 | 1.7 | 2.6 | 4.6 | 4.5 | 5.2 | 3.2 | 2.1 | 2.8 | 4.1 | 2.6 | 0.6 | 1.2 | 3.9 | 3.6 | 3.2 | 3.0 | ||
| 1988 | 1.7 | 1.9 | 2.2 | 1.6 | 3.8 | 2.1 | 1.5 | 1.7 | 3.5 | 2.1 | 3.0 | 1.4 | 1.7 | 2.6 | 1.8 | 2.9 | 2.2 | ||
| 1987 | 0.0 | 0.0 | 0.4 | 1.6 | 1.5 | 0.5 | 0.5 | 2.1 | 1.0 | 2.1 | 1.3 | 2.0 | 1.7 | 1.2 | 1.1 | 1.5 | 1.3 | ||
| 1986 | 0.0 | 0.0 | 0.0 | 0.0 | 2.1 | 0.0 | 0.0 | 0.0 | 0.0 | 0.0 | 0.0 | 0.0 | 0.0 | 0.7 | 0.0 | 0.0 | 0.2 | ||
| 1985 | 0.0 | 0.0 | 0.0 | 0.0 | 0.0 | 0.0 | 0.0 | 0.0 | 0.0 | 0.0 | 0.0 | 0.0 | 0.0 | 0.0 | 0.0 | 0.0 | 0.0 | ||
| 1984 | 0.0 | 0.0 | 0.0 | 0.0 | 0.0 | 0.0 | 0.0 | 0.0 | 0.0 | 0.0 | 0.0 | 0.0 | 0.0 | 0.0 | 0.0 | 0.0 | 0.0 | ||
| 1983 | 0.0 | 0.0 | 0.0 | 0.0 | 0.0 | 0.0 | 0.0 | 0.0 | 0.0 | - | 0.0 | 0.0 | 0.0 | 0.0 | 0.0 | 0.0 | 0.0 | ||
| 1982 | - | 0.0 | - | 0.0 | 0.0 | 0.0 | - | 0.0 | - | 0.0 | - | 0.0 | 0.0 | 0.0 | 0.0 | 0.0 | 0.0 | ||
Breeding data
Breeding records by month
Number of breeding records by breeding code and month, 2017 and all years| Breeding code | Jul | Aug | Sep | Oct | Nov | Dec | Jan | Feb | Mar | Apr | May | Jun |
|---|---|---|---|---|---|---|---|---|---|---|---|---|
| 2017 | ||||||||||||
| Breeding (BLA code) | 0 | 0 | 0 | 0 | 0 | 0 | 0 | 0 | 0 | 0 | 0 | 0 |
| Carrying Food | 0 | 0 | 0 | 0 | 0 | 0 | 0 | 0 | 0 | 0 | 0 | 0 |
| Copulating | 0 | 0 | 0 | 0 | 0 | 0 | 0 | 0 | 0 | 0 | 0 | 0 |
| Display | 0 | 0 | 0 | 0 | 0 | 0 | 0 | 0 | 0 | 0 | 0 | 0 |
| Dependent young | 0 | 0 | 0 | 0 | 0 | 0 | 0 | 2 | 1 | 0 | 0 | 0 |
| Faecal sac | 0 | 0 | 0 | 0 | 0 | 0 | 0 | 0 | 0 | 0 | 0 | 0 |
| Inspecting hollow | 0 | 0 | 0 | 0 | 0 | 0 | 0 | 0 | 0 | 0 | 0 | 0 |
| Nest building | 0 | 0 | 0 | 0 | 0 | 0 | 0 | 0 | 0 | 0 | 0 | 0 |
| Nest with eggs | 0 | 0 | 0 | 0 | 0 | 0 | 0 | 0 | 0 | 0 | 0 | 0 |
| Nest with young | 0 | 0 | 0 | 0 | 0 | 0 | 0 | 0 | 0 | 0 | 0 | 0 |
| On/leaving nest | 0 | 0 | 0 | 0 | 0 | 0 | 0 | 0 | 0 | 0 | 0 | 0 |
| All years | ||||||||||||
| Breeding (BLA code) | 0 | 0 | 0 | 0 | 0 | 1 | 0 | 0 | 1 | 0 | 0 | 0 |
| Carrying Food | 0 | 0 | 0 | 0 | 0 | 0 | 1 | 0 | 0 | 0 | 0 | 0 |
| Copulating | 0 | 0 | 0 | 0 | 0 | 0 | 0 | 0 | 0 | 0 | 0 | 0 |
| Display | 0 | 0 | 0 | 0 | 0 | 0 | 0 | 0 | 0 | 0 | 1 | 0 |
| Dependent young | 0 | 0 | 0 | 1 | 2 | 5 | 9 | 16 | 13 | 1 | 0 | 0 |
| Faecal sac | 0 | 0 | 0 | 0 | 0 | 0 | 0 | 0 | 0 | 0 | 0 | 0 |
| Inspecting hollow | 0 | 0 | 0 | 0 | 0 | 0 | 0 | 0 | 0 | 0 | 0 | 0 |
| Nest building | 0 | 0 | 0 | 2 | 0 | 2 | 0 | 0 | 0 | 0 | 0 | 0 |
| Nest with eggs | 0 | 0 | 0 | 0 | 0 | 0 | 0 | 0 | 0 | 0 | 0 | 0 |
| Nest with young | 0 | 0 | 0 | 0 | 0 | 1 | 0 | 0 | 0 | 0 | 0 | 0 |
| On/leaving nest | 0 | 0 | 0 | 0 | 1 | 0 | 2 | 0 | 0 | 0 | 0 | 0 |
Breeding records by year
Average number of breeding records per period by breeding code| Period | Breeding (BLA code) | Carrying Food | Copulating | Display | Dependent young | Faecal sac | Inspecting hollow | Nest building | Nest with eggs | Nest with young | On/leaving nest |
|---|---|---|---|---|---|---|---|---|---|---|---|
| All years | |||||||||||
| All | 0.1 | 0.0 | 0.0 | 0.0 | 1.3 | 0.0 | 0.0 | 0.1 | 0.0 | 0.0 | 0.1 |
| Previous years | |||||||||||
| All previous years | 0.1 | 0.0 | 0.0 | 0.0 | 1.3 | 0.0 | 0.0 | 0.1 | 0.0 | 0.0 | 0.1 |
| Previous 30 years | 0.1 | 0.0 | 0.0 | 0.0 | 1.5 | 0.0 | 0.0 | 0.1 | 0.0 | 0.0 | 0.1 |
| Previous 20 years | 0.1 | 0.0 | 0.0 | 0.0 | 1.6 | 0.0 | 0.0 | 0.2 | 0.0 | 0.0 | 0.1 |
| 10 year groups | |||||||||||
| [2007,2017) | 0.0 | 0.0 | 0.0 | 0.1 | 1.9 | 0.0 | 0.0 | 0.1 | 0.0 | 0.0 | 0.1 |
| [1997,2007) | 0.2 | 0.0 | 0.0 | 0.0 | 1.2 | 0.0 | 0.0 | 0.3 | 0.0 | 0.0 | 0.2 |
| [1987,1997) | 0.0 | 0.1 | 0.0 | 0.0 | 1.3 | 0.0 | 0.0 | 0.0 | 0.0 | 0.1 | 0.0 |
| 5 year groups | |||||||||||
| [2012,2017) | 0.0 | 0.0 | 0.0 | 0.0 | 2.4 | 0.0 | 0.0 | 0.2 | 0.0 | 0.0 | 0.0 |
| [2007,2012) | 0.0 | 0.0 | 0.0 | 0.2 | 1.4 | 0.0 | 0.0 | 0.0 | 0.0 | 0.0 | 0.2 |
| [2002,2007) | 0.2 | 0.0 | 0.0 | 0.0 | 1.8 | 0.0 | 0.0 | 0.4 | 0.0 | 0.0 | 0.4 |
| [1997,2002) | 0.2 | 0.0 | 0.0 | 0.0 | 0.6 | 0.0 | 0.0 | 0.2 | 0.0 | 0.0 | 0.0 |
| [1992,1997) | 0.0 | 0.2 | 0.0 | 0.0 | 0.4 | 0.0 | 0.0 | 0.0 | 0.0 | 0.2 | 0.0 |
| [1987,1992) | 0.0 | 0.0 | 0.0 | 0.0 | 2.2 | 0.0 | 0.0 | 0.0 | 0.0 | 0.0 | 0.0 |
| Year | |||||||||||
| 2017 | 0.0 | 0.0 | 0.0 | 0.0 | 3.0 | 0.0 | 0.0 | 0.0 | 0.0 | 0.0 | 0.0 |
| 2016 | 0.0 | 0.0 | 0.0 | 0.0 | 4.0 | 0.0 | 0.0 | 1.0 | 0.0 | 0.0 | 0.0 |
| 2015 | 0.0 | 0.0 | 0.0 | 0.0 | 4.0 | 0.0 | 0.0 | 0.0 | 0.0 | 0.0 | 0.0 |
| 2014 | 0.0 | 0.0 | 0.0 | 0.0 | 1.0 | 0.0 | 0.0 | 0.0 | 0.0 | 0.0 | 0.0 |
| 2013 | 0.0 | 0.0 | 0.0 | 0.0 | 0.0 | 0.0 | 0.0 | 0.0 | 0.0 | 0.0 | 0.0 |
| 2012 | 0.0 | 0.0 | 0.0 | 0.0 | 3.0 | 0.0 | 0.0 | 0.0 | 0.0 | 0.0 | 0.0 |
| 2011 | 0.0 | 0.0 | 0.0 | 0.0 | 2.0 | 0.0 | 0.0 | 0.0 | 0.0 | 0.0 | 1.0 |
| 2010 | 0.0 | 0.0 | 0.0 | 0.0 | 0.0 | 0.0 | 0.0 | 0.0 | 0.0 | 0.0 | 0.0 |
| 2009 | 0.0 | 0.0 | 0.0 | 0.0 | 1.0 | 0.0 | 0.0 | 0.0 | 0.0 | 0.0 | 0.0 |
| 2008 | 0.0 | 0.0 | 0.0 | 0.0 | 3.0 | 0.0 | 0.0 | 0.0 | 0.0 | 0.0 | 0.0 |
| 2007 | 0.0 | 0.0 | 0.0 | 1.0 | 1.0 | 0.0 | 0.0 | 0.0 | 0.0 | 0.0 | 0.0 |
| 2006 | 1.0 | 0.0 | 0.0 | 0.0 | 2.0 | 0.0 | 0.0 | 0.0 | 0.0 | 0.0 | 0.0 |
| 2005 | 0.0 | 0.0 | 0.0 | 0.0 | 3.0 | 0.0 | 0.0 | 0.0 | 0.0 | 0.0 | 0.0 |
| 2004 | 0.0 | 0.0 | 0.0 | 0.0 | 2.0 | 0.0 | 0.0 | 2.0 | 0.0 | 0.0 | 2.0 |
| 2003 | 0.0 | 0.0 | 0.0 | 0.0 | 1.0 | 0.0 | 0.0 | 0.0 | 0.0 | 0.0 | 0.0 |
| 2002 | 0.0 | 0.0 | 0.0 | 0.0 | 1.0 | 0.0 | 0.0 | 0.0 | 0.0 | 0.0 | 0.0 |
| 2001 | 0.0 | 0.0 | 0.0 | 0.0 | 0.0 | 0.0 | 0.0 | 0.0 | 0.0 | 0.0 | 0.0 |
| 2000 | 1.0 | 0.0 | 0.0 | 0.0 | 2.0 | 0.0 | 0.0 | 0.0 | 0.0 | 0.0 | 0.0 |
| 1999 | 0.0 | 0.0 | 0.0 | 0.0 | 0.0 | 0.0 | 0.0 | 1.0 | 0.0 | 0.0 | 0.0 |
| 1998 | 0.0 | 0.0 | 0.0 | 0.0 | 1.0 | 0.0 | 0.0 | 0.0 | 0.0 | 0.0 | 0.0 |
| 1997 | 0.0 | 0.0 | 0.0 | 0.0 | 0.0 | 0.0 | 0.0 | 0.0 | 0.0 | 0.0 | 0.0 |
| 1996 | 0.0 | 1.0 | 0.0 | 0.0 | 0.0 | 0.0 | 0.0 | 0.0 | 0.0 | 0.0 | 0.0 |
| 1995 | 0.0 | 0.0 | 0.0 | 0.0 | 2.0 | 0.0 | 0.0 | 0.0 | 0.0 | 0.0 | 0.0 |
| 1994 | 0.0 | 0.0 | 0.0 | 0.0 | 0.0 | 0.0 | 0.0 | 0.0 | 0.0 | 0.0 | 0.0 |
| 1993 | 0.0 | 0.0 | 0.0 | 0.0 | 0.0 | 0.0 | 0.0 | 0.0 | 0.0 | 1.0 | 0.0 |
| 1992 | 0.0 | 0.0 | 0.0 | 0.0 | 0.0 | 0.0 | 0.0 | 0.0 | 0.0 | 0.0 | 0.0 |
| 1991 | 0.0 | 0.0 | 0.0 | 0.0 | 2.0 | 0.0 | 0.0 | 0.0 | 0.0 | 0.0 | 0.0 |
| 1990 | 0.0 | 0.0 | 0.0 | 0.0 | 2.0 | 0.0 | 0.0 | 0.0 | 0.0 | 0.0 | 0.0 |
| 1989 | 0.0 | 0.0 | 0.0 | 0.0 | 4.0 | 0.0 | 0.0 | 0.0 | 0.0 | 0.0 | 0.0 |
| 1988 | 0.0 | 0.0 | 0.0 | 0.0 | 1.0 | 0.0 | 0.0 | 0.0 | 0.0 | 0.0 | 0.0 |
| 1987 | 0.0 | 0.0 | 0.0 | 0.0 | 2.0 | 0.0 | 0.0 | 0.0 | 0.0 | 0.0 | 0.0 |
| 1986 | 0.0 | 0.0 | 0.0 | 0.0 | 0.0 | 0.0 | 0.0 | 0.0 | 0.0 | 0.0 | 0.0 |
| 1985 | 0.0 | 0.0 | 0.0 | 0.0 | 0.0 | 0.0 | 0.0 | 0.0 | 0.0 | 0.0 | 0.0 |
| 1984 | 0.0 | 0.0 | 0.0 | 0.0 | 0.0 | 0.0 | 0.0 | 0.0 | 0.0 | 0.0 | 0.0 |
| 1983 | 0.0 | 0.0 | 0.0 | 0.0 | 0.0 | 0.0 | 0.0 | 0.0 | 0.0 | 0.0 | 0.0 |
| 1982 | 0.0 | 0.0 | 0.0 | 0.0 | 0.0 | 0.0 | 0.0 | 0.0 | 0.0 | 0.0 | 0.0 |
Distribution map
Distribution - 2017
This map shows the observed distribution of the Crested Shrike-tit for 2017.
The red circles are the grid cells where Crested Shrike-tit have been reported.
The transparency of the red circles indicate how many surveys sheets were submitted for that grid cell; the darker the red the more reliable the data. Of the 315 grid cells with reports, 83 had only one sheet; an example is grid number O24.
The size of the circle represents the reporting rate. The maximum reporting rate for Crested Shrike-tit was 100.0% (eg grid number O24) and the minimum was 3.1% (eg grid number J12). 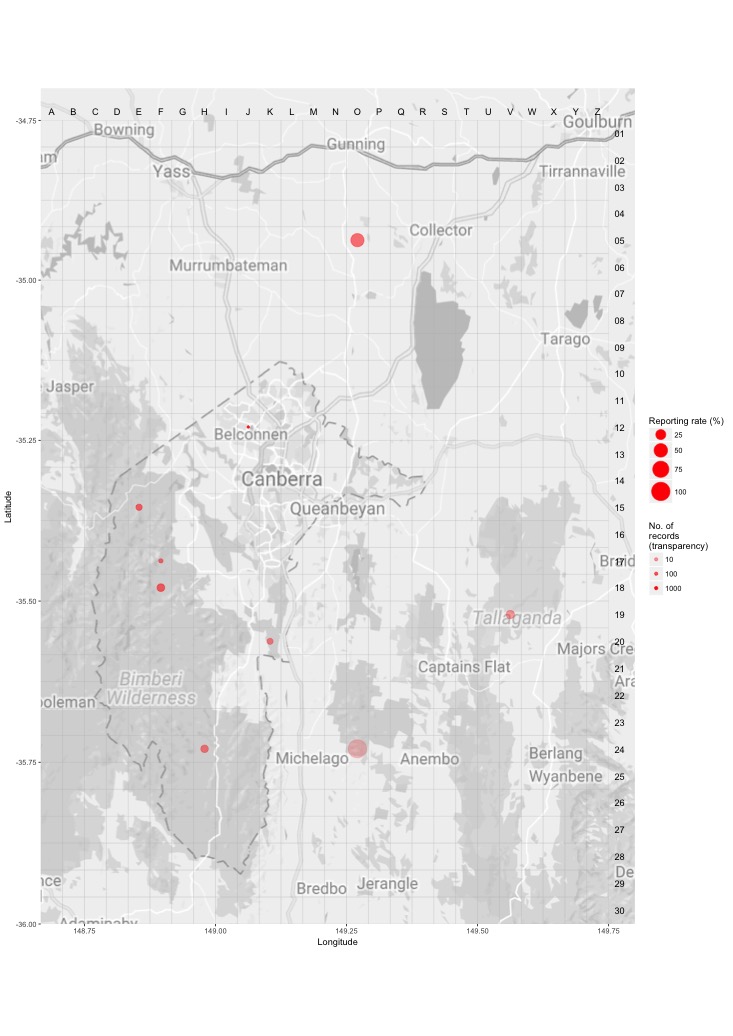
Distribution - all years
This map shows the observed distribution of the Crested Shrike-tit for all years.
The red circles are the grid cells where Crested Shrike-tit have been reported.
The transparency of the red circles indicate how many surveys sheets were submitted for that grid cell; the darker the red the more reliable the data. Of the 703 grid cells with reports, 55 had only one sheet; an example is grid number Z30.
The size of the circle represents the reporting rate. The maximum reporting rate for Crested Shrike-tit was 100.0% (eg grid number Z30) and the minimum was 0.0% (eg grid number L14). 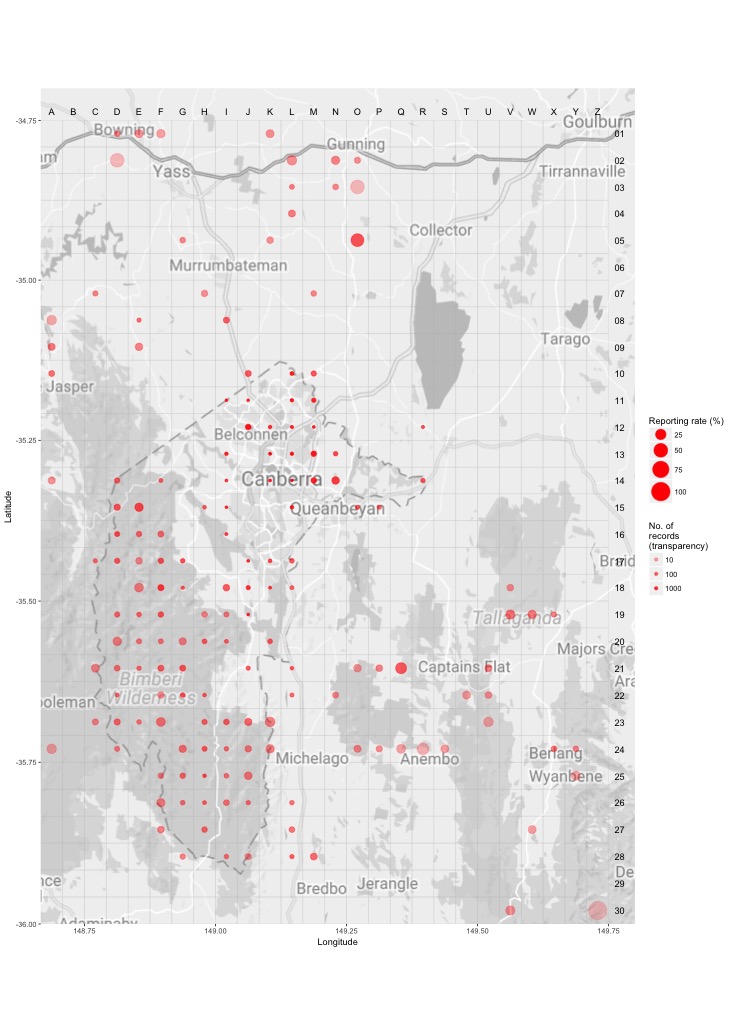
Breeding map
Breeding - 2017
This map shows the breeding distribution of the Crested Shrike-tit for 2017.
The red circles are the grid cells where breeding activity for Crested Shrike-tit have been reported.
The size of the circle represents the number of reports. 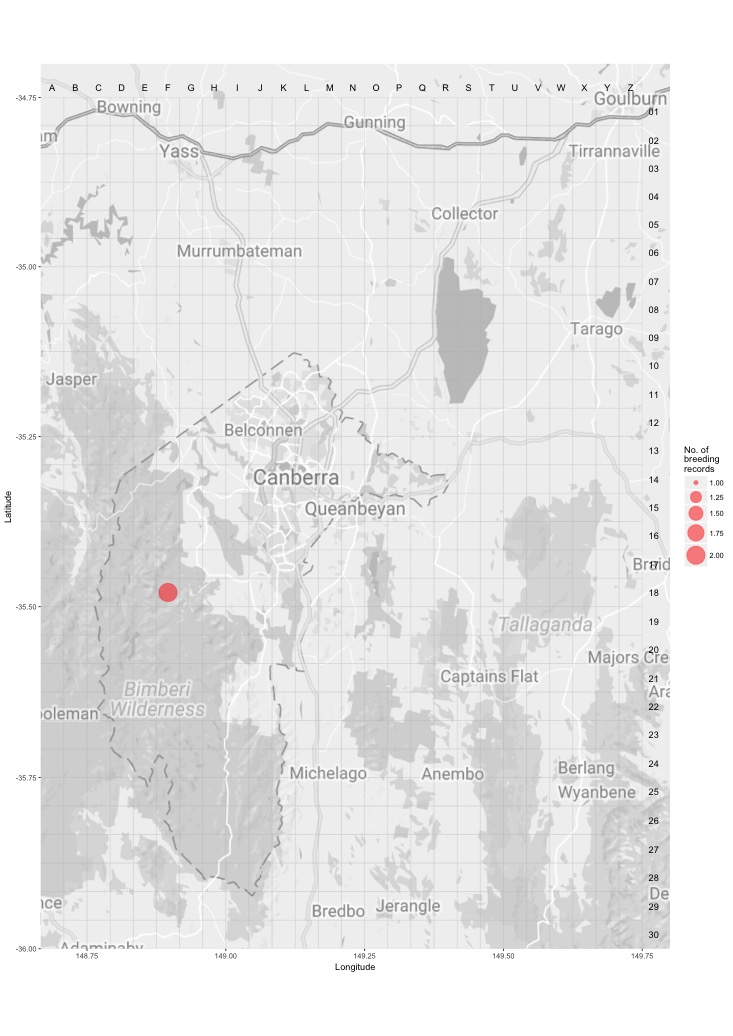
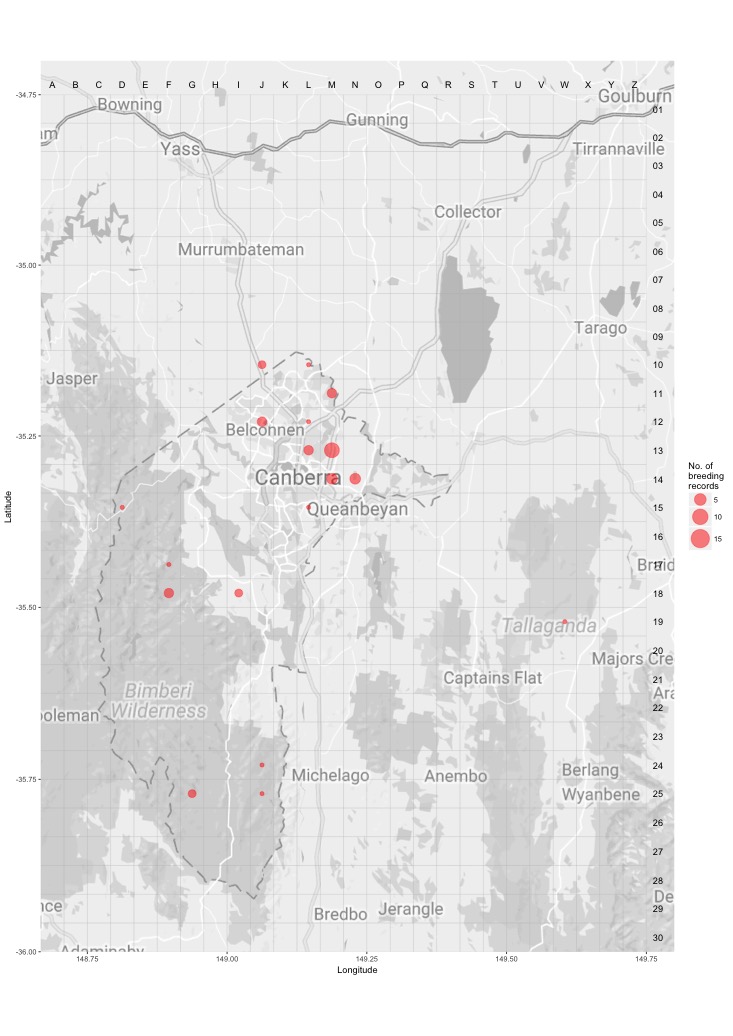
Breeding - all years
This map shows the breeding distribution of the Crested Shrike-tit for all years.
The red circles are the grid cells where breeding activity for Crested Shrike-tit have been reported.
The size of the circle represents the number of reports.